Finding My Voice
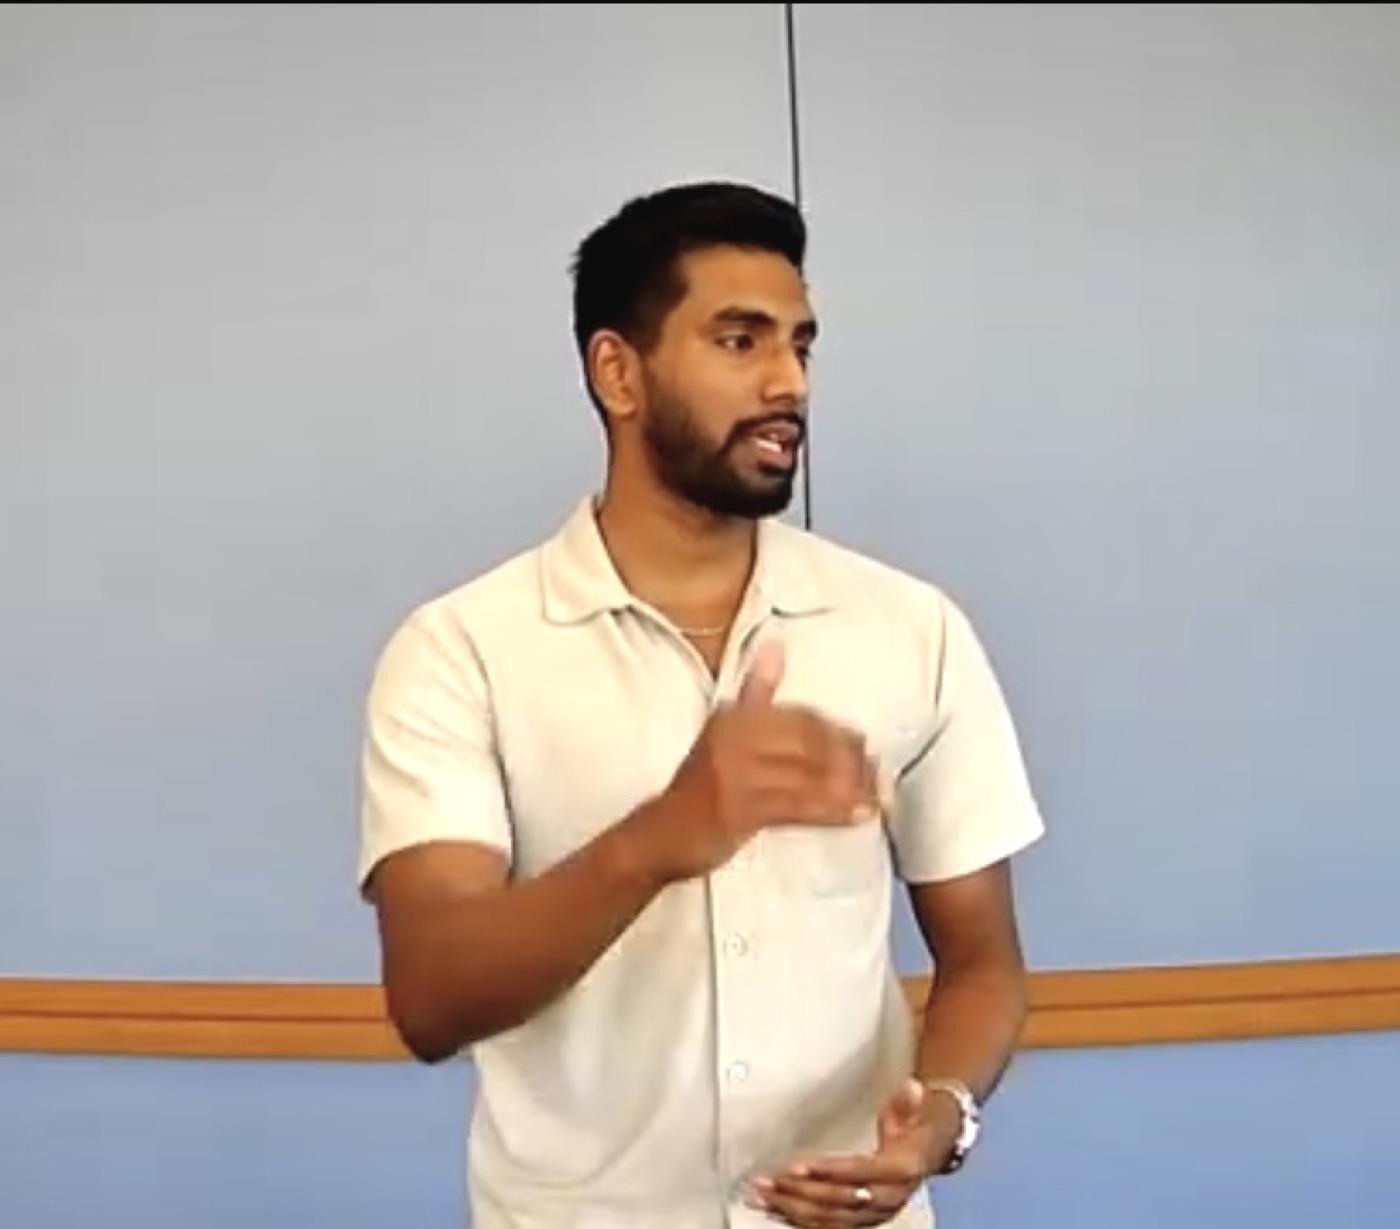
My public speaking journey started with Toastmasters, a public speaking organization where members practice speeches, get real-time feedback, and build confidence speaking on their feet. It began back in Mumbai, picked back up with Arlington Nooners, and continues today as an active member of Keller Toastmasters. Years of practice speaking in front of a room has built the confidence, communication, and social instincts I now bring to every presentation and conversation.
Professional Experience
Present
Inventory Optimization Analyst
Shoppa's Material Handling

- Built a Python-based reorder point (ROP) forecasting tool, reducing manual replenishment calculations by 25%.
- Developed an Open PO Dashboard surfacing abandoned and overdue purchase orders, protecting approximately $8 million in inventory value and driving procurement recovery efforts.
- Designed Power BI dashboards delivering actionable insights across demand forecasting, lead time, open POs, and logistics optimization, cutting manual reporting time by 6+ hours per week.
- Optimized inventory planning and replenishment within ERP systems, reducing excess inventory by 12% and improving supply reliability.
- Coordinated with 20+ vendors and cross-functional teams to resolve 150+ backordered units, surfacing risks tied to late POs and constrained supply.
MAY 2025
Graduate Administrative Assistant
University of Texas at Arlington

- Managed and maintained a database of 4,000+ test-takers, ensuring data accuracy, integrity, and compliance with testing policies.
- Optimized documentation workflows, exam scheduling, and check-ins, reducing process time by 20% and improving operational efficiency.
- Mentored and trained 4 team members on database management, system navigation, and key responsibilities.
JUNE 2023
Assistant Systems Engineer
Tata Consultancy Services

- Used SQL to validate backend data for credit card processing, ensuring accuracy in account standing states and supporting data-driven defect analysis — reducing errors by 35%.
- Conducted functional and UAT testing, developing comprehensive test cases based on client use cases for thorough test coverage.
- Executed and managed multiple test cycles in ALM, identifying and tracking defects per release, achieving a 98% defect resolution rate.
- Verified account statuses and transaction processing using TSYS, ensuring compliance with business rules and system requirements.
Projects
Electric Vehicle Data Analysis
- Built an interactive Tableau dashboard analyzing 150K+ EV records across 23 fields to surface adoption trends.
- Engineered calculated fields and advanced formulas (COUNTD, AVG, IF-ELSE) to power KPI visualizations guiding EV adoption strategy.
Customer Segmentation & Personality Analysis
- Applied PCA for dimensionality reduction, driving Decision Tree and Logistic Regression models to 85.55% and 85.10% accuracy.
- Uncovered spending patterns through heat maps and box plots to guide targeted customer decisions.
- Boosted Random Forest accuracy from 84.88% to 85.55% and Logistic Regression from 82.39% to 85.10% post-PCA, while correcting class imbalance.
Excel Sales Dashboard
- Built 5 interactive visualizations using Pivot Tables and Charts to accelerate stakeholder decision-making.
- Cut data filtering time by 50% by implementing interactive slicers, enabling real-time analysis.
Skills
Education
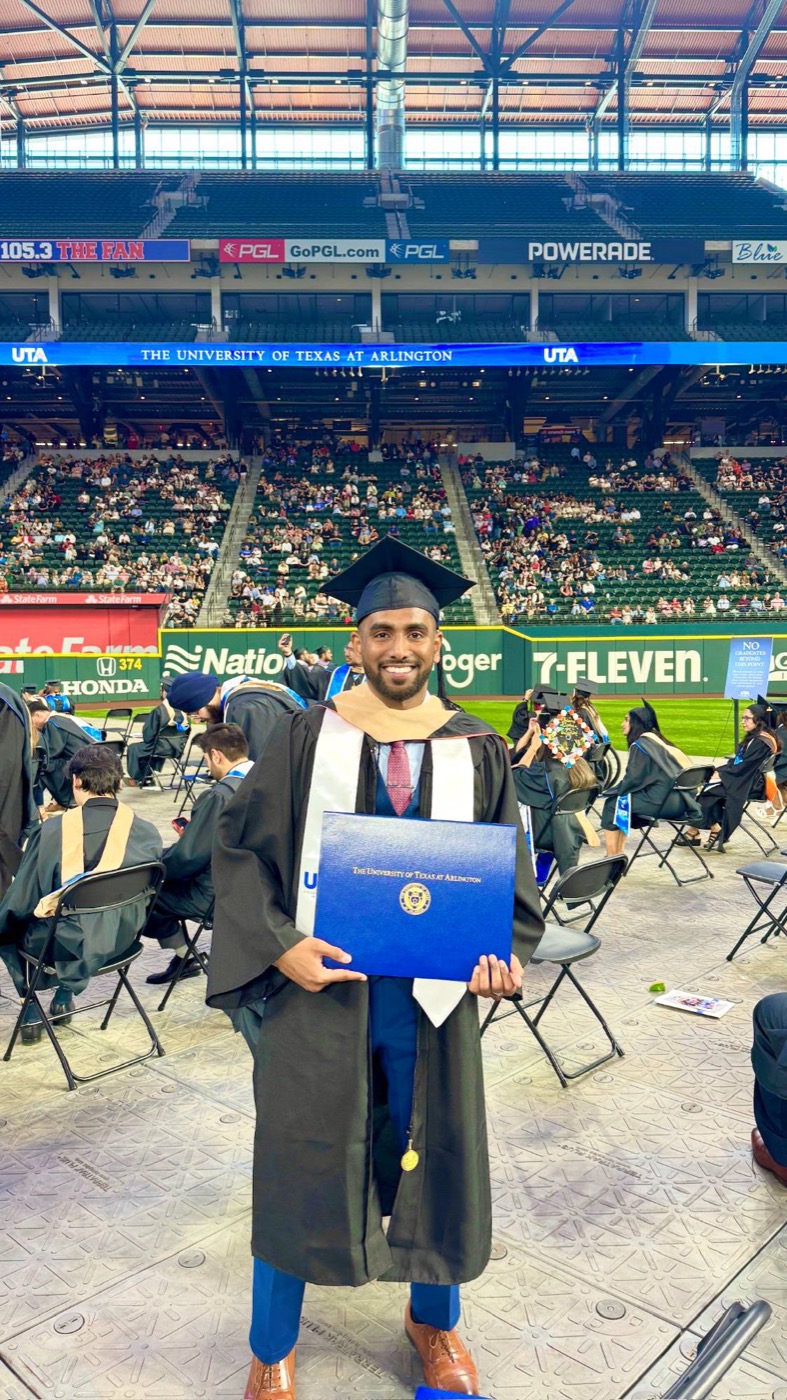
SPRING 2025
Master of Science in Business Analytics
University of Texas at Arlington
SUMMER 2021
Bachelor of Engineering in Electrical Engineering

University of Mumbai, India
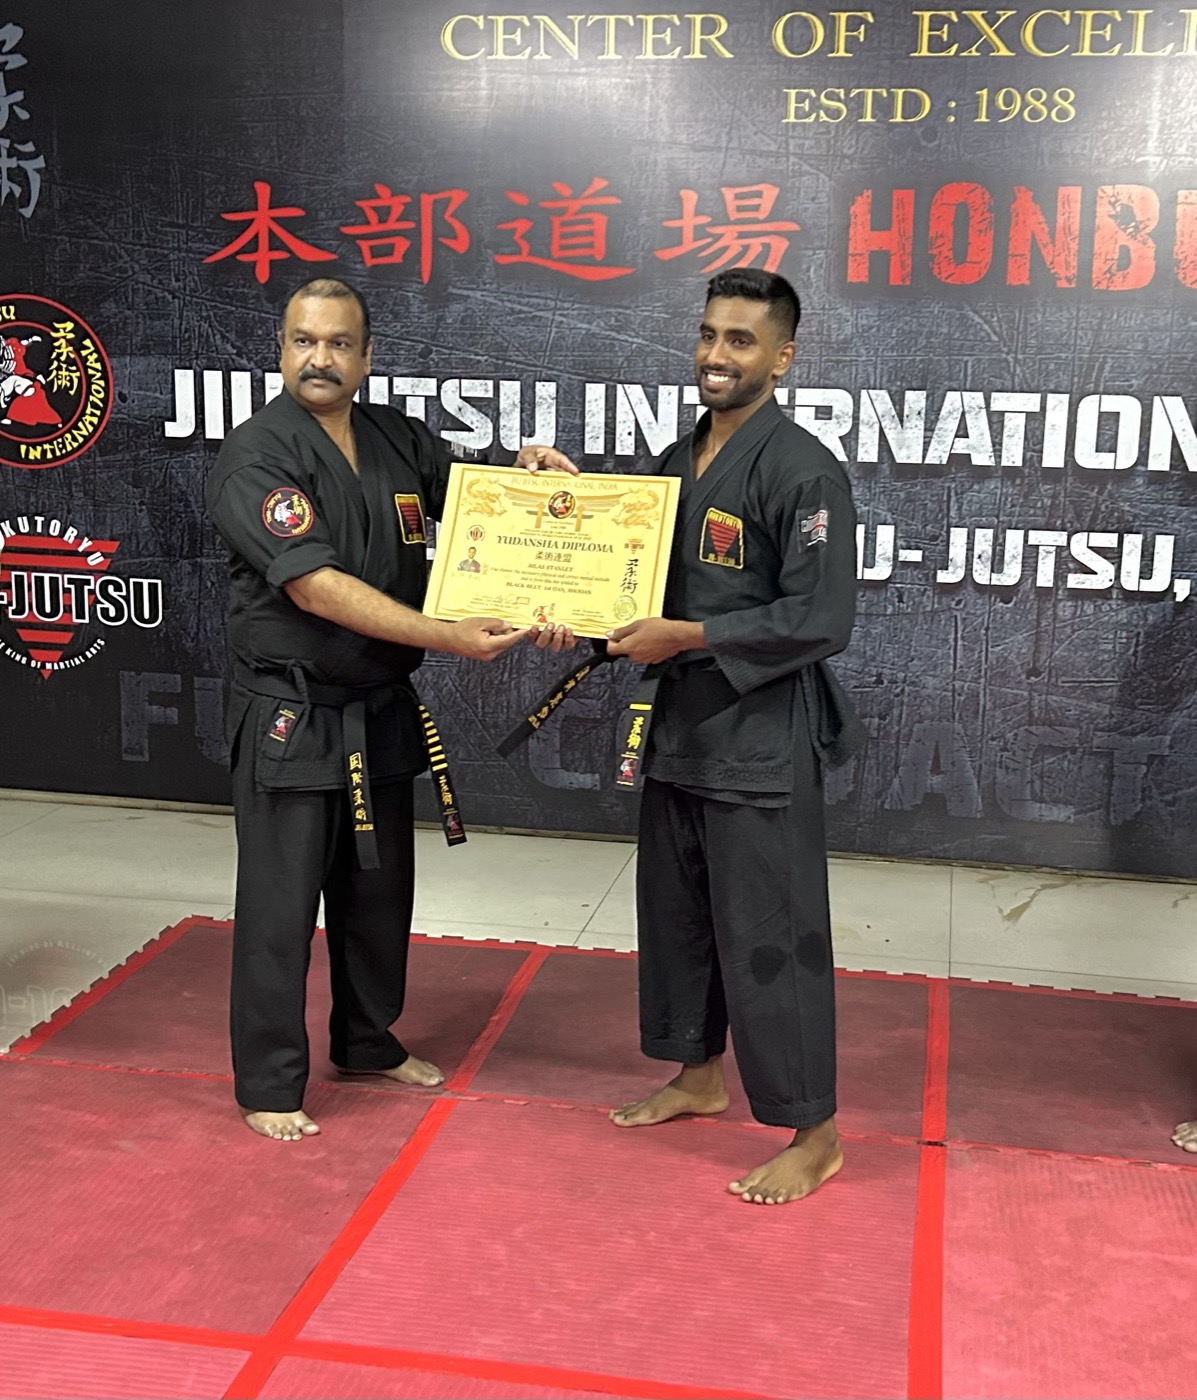
The Curious Black Belt

The Person Behind the Analyst
I'm at my best around new people. Swapping ideas, hearing how other people think, figuring out what makes them tick. That same curiosity is what pulls me into data in the first place: I don't stop until I've found the actual root cause, not just the symptom.
Lately that's spilled over into content creation on LinkedIn, where I recently crossed 10K followers, sharing what I'm learning, consistently, as I learn it.
Always up for a conversation. About data, about ideas, or just to connect.